
Custom Reports
A daily hazard report built around your own sites
Send us your list of stores, plants, offices or suppliers. Every morning, DisasterAWARE checks each one against active hazards and tells you which sites are affected, which are newly affected, which moved closer to a hazard, and which are clear again.
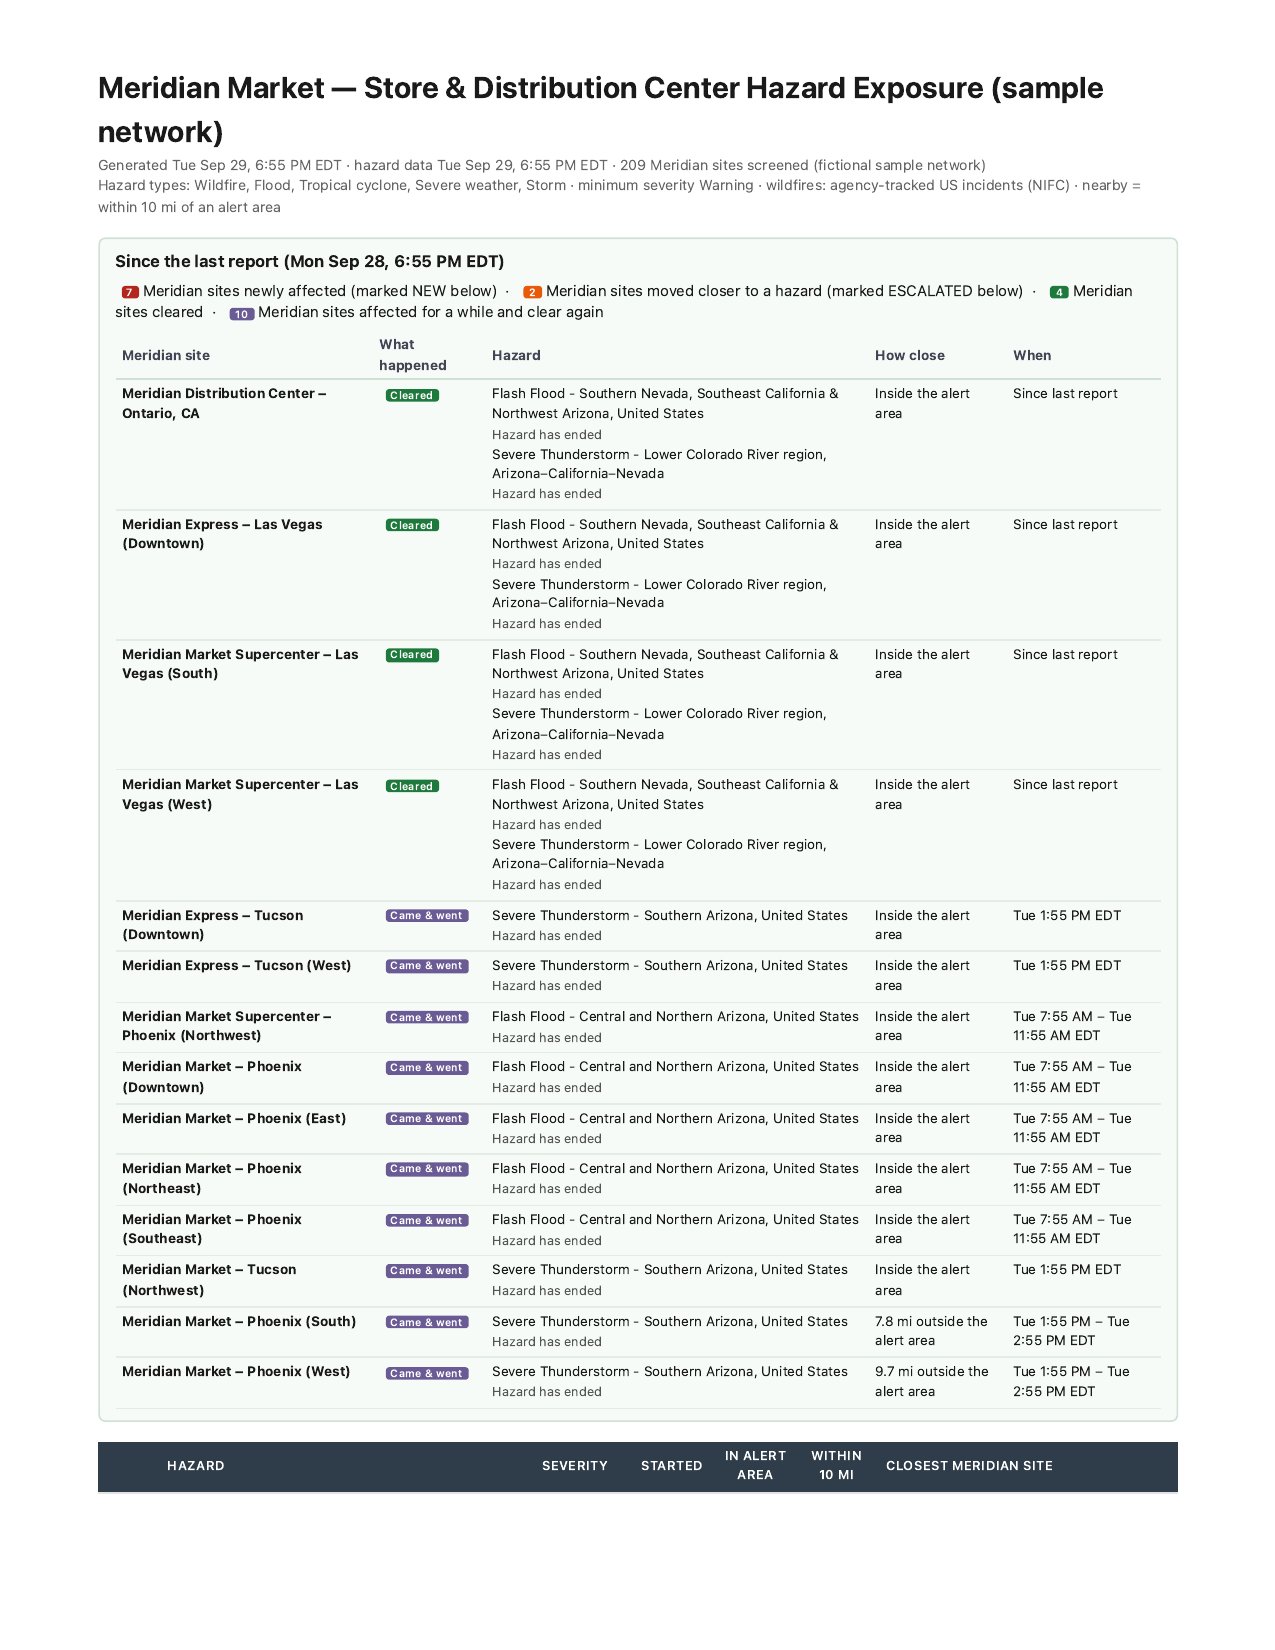
Sample report, page 1 · fictional retail network, real hazards of September 29, 2026
Start with what changed overnight
Each report compares today's picture with the last report, so you see movement, not a wall of alerts. Changes are tracked per site and hazard type, so a warning that a weather service re-issues doesn't show up as new every time.
Newly affected
A site is now in range of a hazard and wasn't in range of any hazard of that type at the last report.
Moved closer
A site moved inward: from nearby, to inside the alert area, to inside the hazard's own perimeter (a fire perimeter or flood extent).
Cleared
A site was in range at the last report and no hazard of that type affects it now.
Came and went
A site was affected between reports but not at either end, such as a thunderstorm warning issued and expired overnight.
Inside each report
Your sites, every active hazard, one document
What changed since the last report
Every site whose status changed, with the hazard, how close it is, and when it happened.
Every hazard affecting your sites
Type, severity and start date, how many sites are inside the alert area or nearby, and the closest site.
A map for each hazard
The hazard area and alert area with your sites marked, so you can see the situation at a glance.
A site table for each hazard
Your affected sites grouped by metro area or campus, each with its status and distance to the hazard.
Who issued it, and the wider picture
The issuing agency for each hazard, plus DisasterAWARE's estimate of the people and capital exposed to the hazard as a whole.
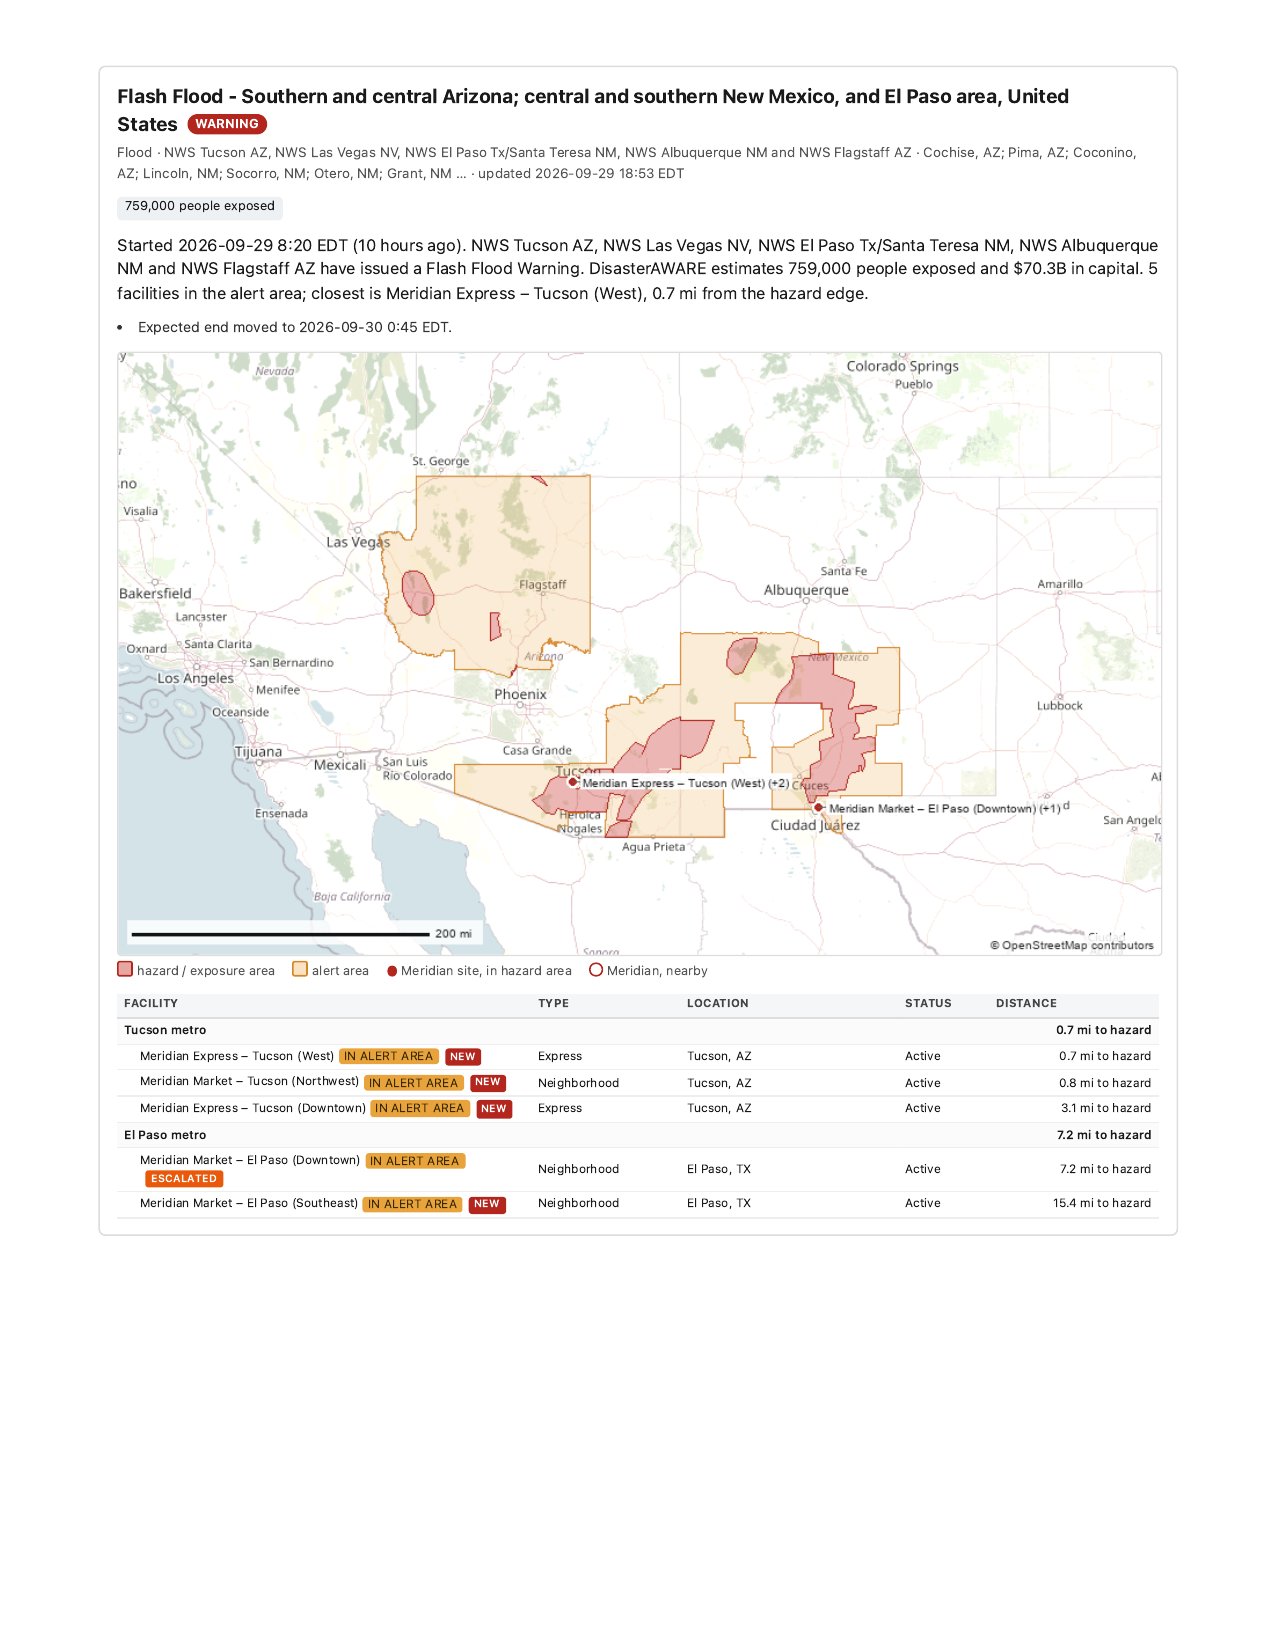
Sample report, page 3 · one page per hazard
How it works
Send us your site list
A spreadsheet (CSV or Excel) or GeoJSON with each site's name and location. Coordinates are all we strictly need; if you only have street addresses, we geocode them during setup. Add type, city, metro area or campus and status if you have them.
We set up your report
Our team chooses the hazard types, severity, nearby distance and layout with you, and names everything the way your organization does.
It arrives every morning
By email, in your time zone: a short plain-language summary in the message, with the full report attached as a PDF.
Tailored to what matters to you
We configure each report with you. You can choose:
- ●Hazard types: any DisasterAWARE hazard type (the sample uses wildfire, flood, tropical cyclone, severe weather and storm)
- ●Minimum severity: information, advisory, watch or warning
- ●How far counts as nearby: sites within a set distance of an alert area (10 miles in the sample)
- ●Whether to include forecasts, watches and model guidance, or only hazards affecting areas now
- ●Your names for your site lists, your time zone, and maps on or off
- ●A second site list, such as suppliers or customer locations, shown in its own colour
- ●The comparison window: a weekly report can compare against the week before
See a full sample report
Seven pages, screening a fictional 209-site retail network against the real hazards of September 29, 2026: flash floods and a flood warning in Arizona, New Mexico and Texas, a severe thunderstorm, Tropical Storm Polo, and heavy rain across Mexico.
Open the sample report (PDF, 7 pages)Questions
Is the sample report a real customer's report?
No. It screens a fictional retail chain, Meridian Market, with 209 sites at approximate downtown locations of real US cities, against the real hazards active on September 29, 2026.
Where does the hazard data come from?
From DisasterAWARE's active hazard feed, the same hazards our API serves. It combines official sources such as national weather services and the NOAA National Hurricane Center with alerts issued by Pacific Disaster Center analysts.
Does it cover sites outside the United States?
Hazard coverage is global, and the screening works anywhere a hazard has a mapped area. Wildfire coverage is currently limited to agency-tracked US incidents.
Are the people and capital figures the exposure of my sites?
No. They are DisasterAWARE's estimate of the people and capital exposed to the hazard as a whole. The report tells you which of your sites are affected and how close each one is; it does not estimate losses at your sites.
Can I get the data rather than a PDF?
The report itself comes by email. If you want machine-readable hazard data for your own systems, the DisasterAWARE Event Intelligence API delivers the same active hazards. About the API →
How often does it run?
The standard report is daily. Talk to us if you need a different schedule or comparison window.
Want a report for your own sites?
Tell us about your locations and what you need to know each morning. We'll walk you through what a report for your sites could include.
Talk to us →